Dónal O'Mahony
Solo build · Research and product definition · Prediction modelling

Jelly Map AppSwimming conditions intelligence for Ireland and the UK, from predictive modelling and live swimmer sightings

“Any jellyfish?” Researched, designed, built and shipped solo. A question asked hundreds of times a day at every ladder and slipway on the coast, turned into a native iOS app that answers it honestly.

DÓNAL O'MAHONY · PERSONAL PROJECT · RESEARCH, DESIGN, BUILD, SHIP

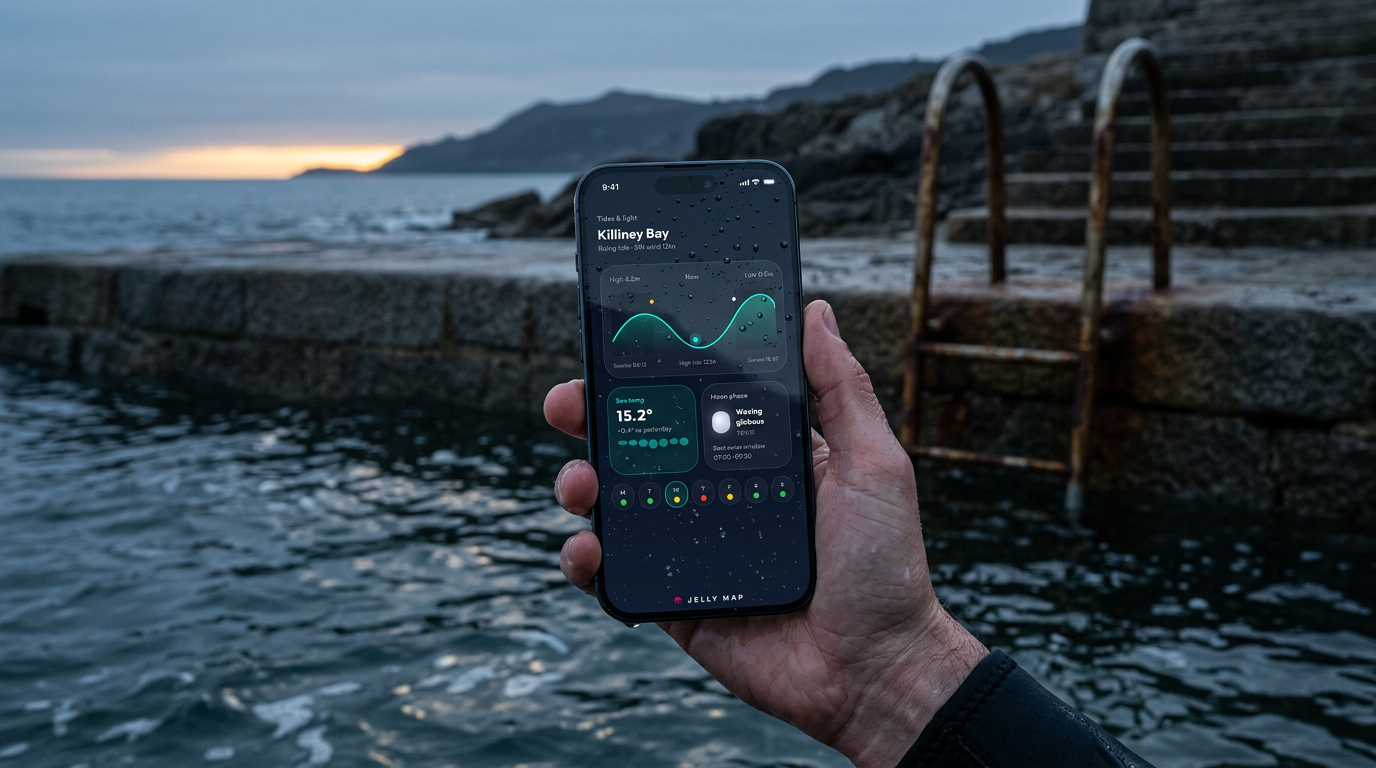
Jelly Map open on a phone held above cold Atlantic water at dawn beside a slipway swimming ladder, showing the dark mode tides and light screen
01

Context

Designers are building now. I have enjoyed that shift at work more than anything in years, so I wanted to try it properly on something of my own.

Figma for thinking. Claude Code in the terminal for the logic, the data modelling and the parts I would previously have specced out. Lovable for the app. Xcode to ship it.

A few evenings rather than months, using the same research and design discipline I have led teams on at Contentful and Verizon Connect, just compressed to one person.

A year ago I could not have built this.

The research and design discipline underneath it is the same one I have led teams on at Contentful and Verizon Connect, just compressed to one person and a few evenings instead of a team and a quarter.

Goals
  • Answer one question on one screen: should I get in? And be honest about how confident the answer is.

  • Carry live swimmer sightings, the thing every existing jellyfish map is missing, with no account and two taps.

  • Predict where nobody is measuring, in the eight months of the year when official bathing water sampling stops.

  • Prove that a designer with a clear vision can research, model, build and ship a native app alone.

Shipped
Swim spots
39live across Ireland and the UK
Modelled catchments
5for rainfall-driven sewage spill probability
Prediction models
2jellyfish likelihood and spill probability, built from public feeds
Price
Freeno purchase, no ads, no account. The paywall was built, then removed

Native iOS. Free. No account.

02

Genesis

It started at home. My family are wary of jellyfish, in the sea here and every summer on holiday. Can we swim? Are there any in? What happens if one of us gets stung? Nobody could ever answer.

Then I noticed the same thing playing out near where I live, in public. At the ladders and slipways along the coast, there is a queue. People waiting to climb down into the water, and people climbing back out. And every time, without fail:

“Any jellyfish?”
Asked hundreds of times a day, at every swim spot in Ireland and the UK

The answer exists. It is in the head of the person climbing out, and it disappears the moment they reach their car.

Plenty of jellyfish maps exist. Marine institutes, citizen science databases, bloom trackers. Excellent for researchers. Almost none carry live user sightings. That is the gap. Someone on a ladder does not want a species distribution map. They want to know what the last person saw.

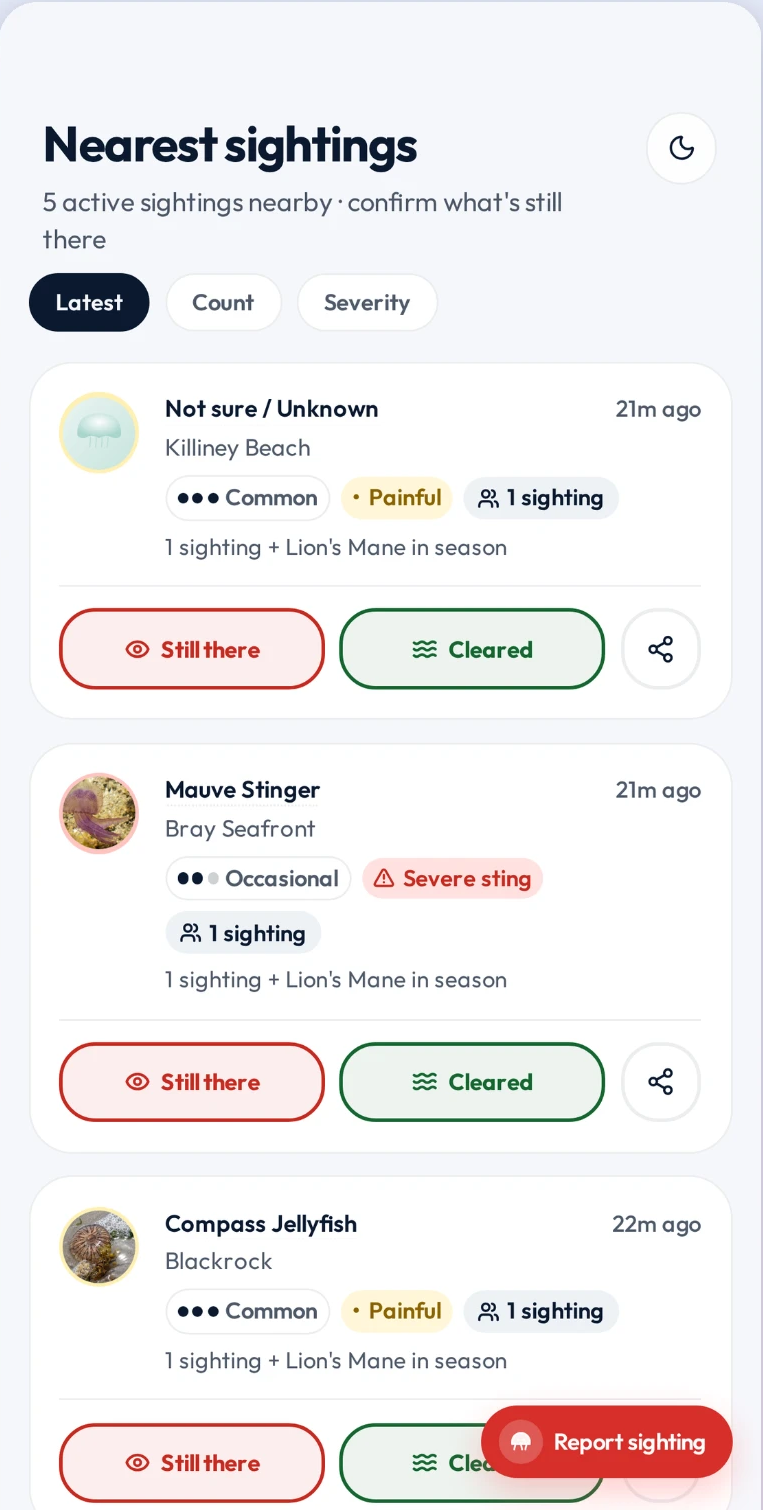
Jelly Map nearest sightings feed, listing live reports from swimmers
Live, local, useful

The answer was already at the water’s edge.

Each report can be confirmed or cleared in one tap. No account required.

The live feed: swimmers verify each other in one tap.
03

Research

Family, friends, the local swimming crowd. Conversations at slipways and in WhatsApp groups. The scope tripled, and every expansion came from them.

1

“It’s not the jellyfish that worries me”

“I’d swim with jellyfish. I’m not swimming after heavy rain.”

Irish and UK coastal towns run combined sewers. Heavy rain overwhelms them and they discharge into the sea. Every regular swimmer knows this. Nobody knows when, because official notices follow fortnightly sampling and arrive days late.

That reframed the product: not where are the jellyfish, but is it safe to get in?

2

“Just tell me the tide”

“I check three apps every morning.”

The highest frequency ask, and the least glamorous. The habit already existed. I just had to be the app they opened first.

03

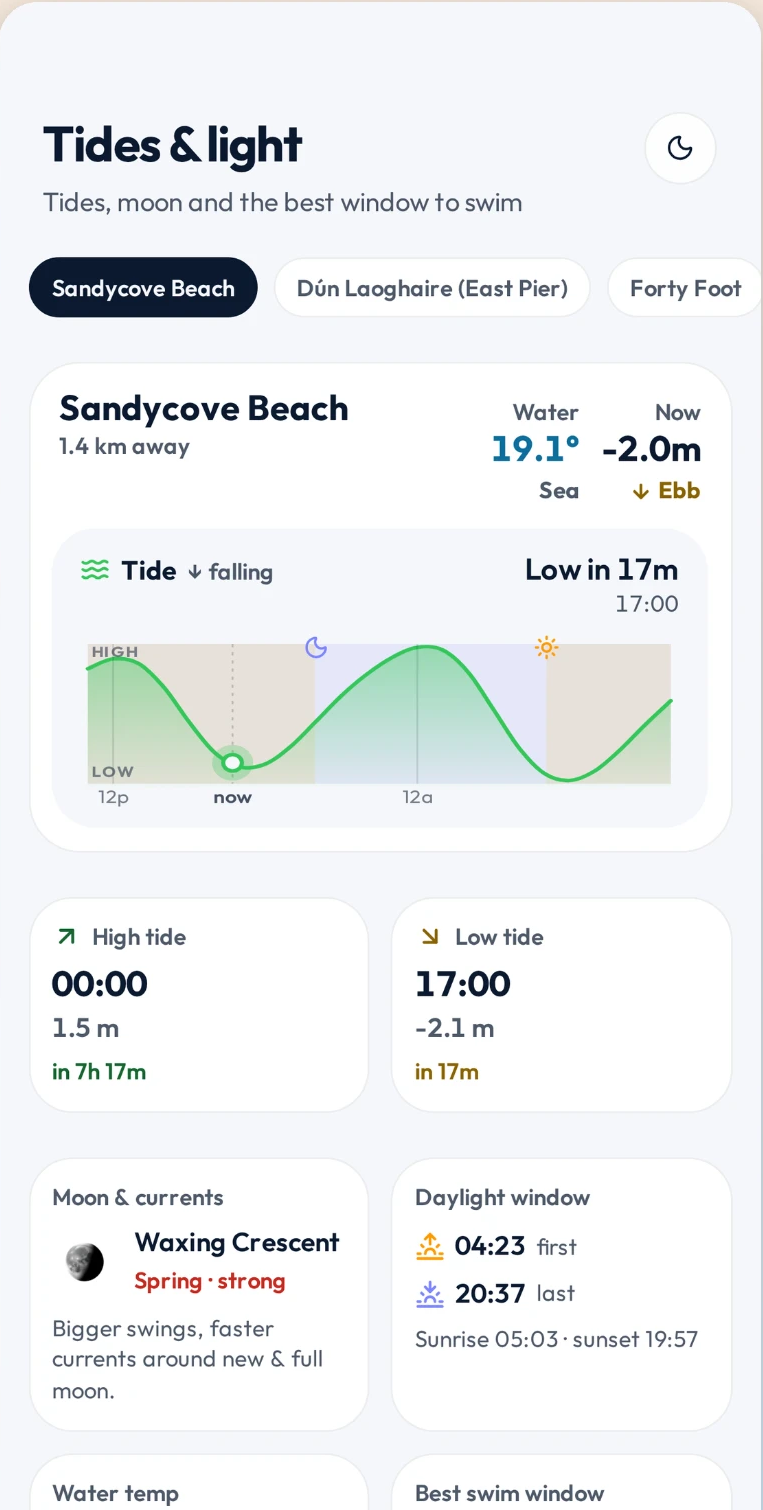
One clear view of the day, not three weather apps.

Tide direction, sea temperature, moon, daylight and the best swim window remain readable as one system.

Jelly Map tides and light screen for Sandycove Beach
Tides, sea temperature, moon phase and the best window to swim.
3

“There are way more than there used to be”

Unexpected. People wanted to talk about jellyfish: warming seas, longer seasons, new species. Older swimmers had long memories and strong opinions. That turned a utility into something with a bit of soul: species guide, sting first aid, what is in season and why.

Identify · Understand · Act

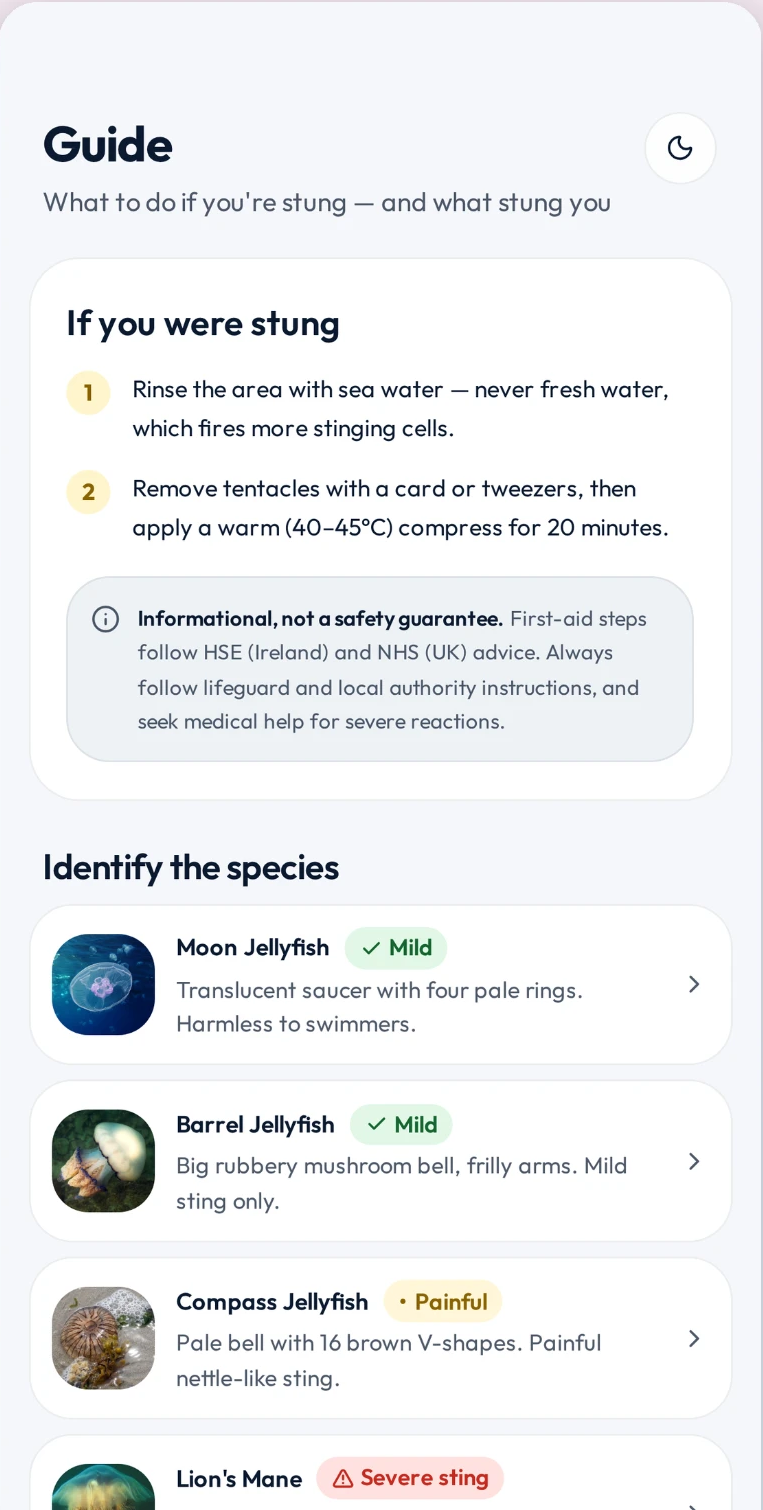
Recognition and first aid belong in the same place.

Plain severity labels make the guide useful at the moment someone needs it.

Jelly Map guide with sting first aid and jellyfish species
Identify every species, with HSE and NHS sting first aid in seconds.
04

The intelligence

Four systems sit behind the one screen. Each one reads a set of signals, makes a judgement a swimmer can act on, and refuses to do certain things. The refusals matter as much as the answers.

01

Jellyfish likelihood

Reads

which species are in season and how badly they sting · sea temperature against seasonal norms · wind direction measured against each beach’s own orientation · tide state and movement · live swimmer reports.

Judges

whether an offshore bloom is likely to reach this bay today. A beach facing the wrong way in the same wind has a different answer to its neighbour.

Refuses

to let quiet reporting read as good news. Sightings can only ever push risk up.
02

Waste spill probability

Reads

live rainfall from official gauges · how saturated the ground already is from the previous 48 hours · each catchment’s runoff behaviour · the travel time from overflow to that specific beach.

Judges

not is it raining, but has this network taken on more than it can hold, and when does that arrive here, often hours before an official notice.

Refuses

to outrank an authority. Council and EPA notices always win.

03

Tide & swim conditions

Reads

tide height and direction · sea temperature · wind · daylight, sunrise and moon phase.

Judges

the practical question: when today is actually good? Most people plan around high water, not low.

Refuses

to invent a window when there isn’t one.

04

Alerts & digest

Reads

all three models, plus what it told you yesterday.

Judges

a strict priority order: official notice, then modelled spill, then a fresh sighting, then jellyfish risk. The title carries the verdict in a few words. Arrives at a time you choose.

Refuses

to repeat itself, or to wake you to say everything is fine.

This is the part a designer does not get to build. Working with an agent changed that. I brought the domain knowledge, the research and the judgement about what a swimmer would actually trust, and got a collaborator for the data plumbing and the API work. Not code generation. Genuine argument about whether a fallback was honest, and whether a number could be stood over.

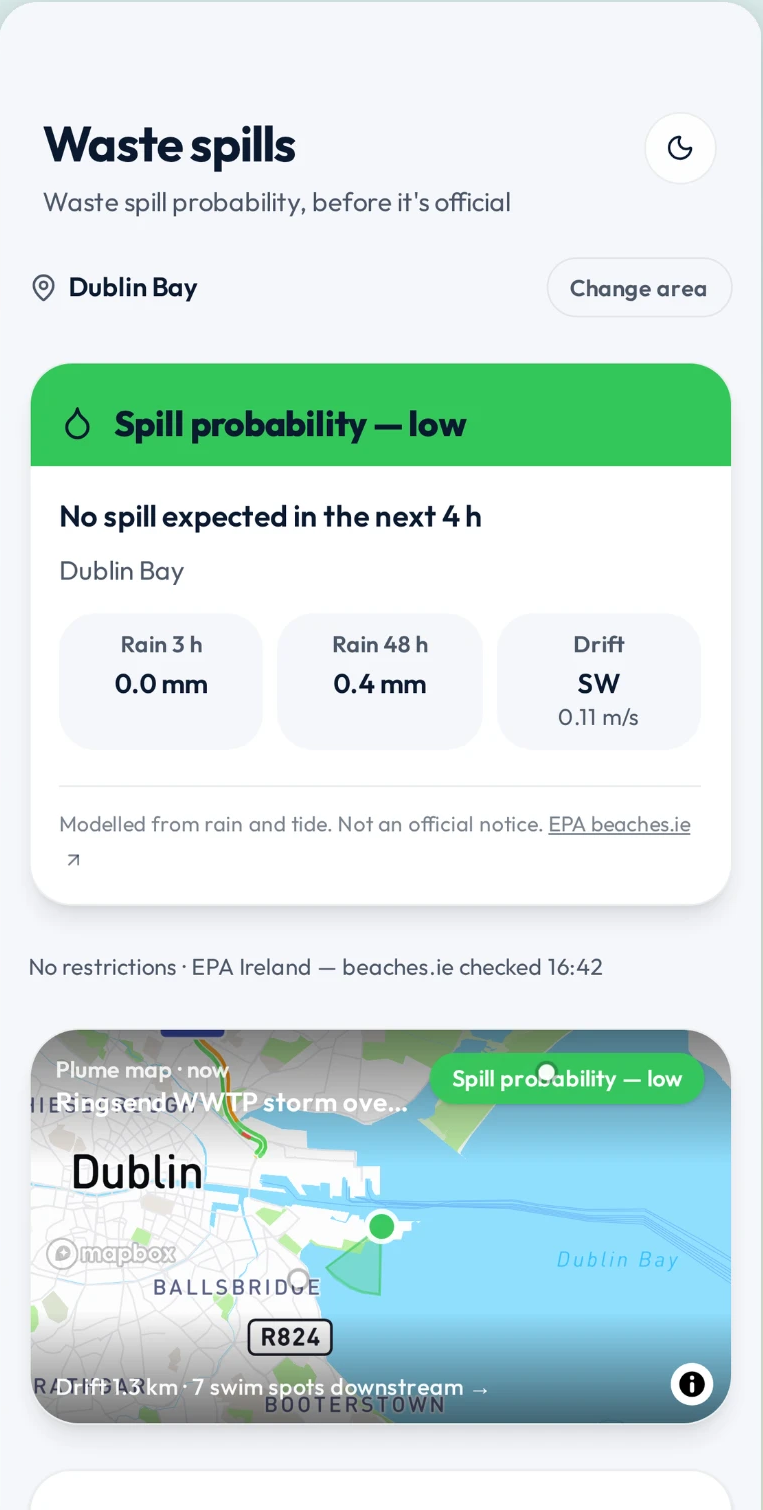
Jelly Map waste spills screen for Dublin Bay, showing low spill probability, rainfall, drift and the modelled plume map

The spill model in the product, hours ahead of an official notice

05

Principles

Every hard call got resolved by one of these.

01

Never claim safety from absence of data

An empty feed once said “All clear.” It felt great. It was a lie, because nobody reporting does not mean nothing is there. It usually means nobody looked.

Nobody has flagged jellyfish here recently. That’s not the same as all clear.

Less satisfying. Honest. The line I would want to stand over if someone got hurt.

02

Always say where a number came from

Every figure carries provenance: Forecast, Verified, or both. Official notices are visually distinct from predictions, and official always wins. We can raise an alarm. We can never talk one down.

03

Predict where nobody is measuring

Official notices are reactive by design. In Ireland the monitoring season runs June to mid-September, while sea swimming is now year round. That gap is the product: modelled likelihood, hours ahead, available in the eight months when nobody is testing at all.

04

Location stays on the device

Coordinates never leave the phone. Every request is keyed by beach ID.

06

Two things I did not expect

Licences shaped the product more than wireframes did

Free weather APIs are often non-commercial only. Open data is not the same as free to use. Rebuilding around commercially licensed sources, Environment Agency gauges, Met Éireann and EPA Ireland, produced something better than what it replaced: real tipping-bucket gauges within 7 km of every modelled outfall, instead of a model grid.

Building the paywall taught me not to have one

€2.99Free

A one-time €2.99 unlock. Deliberately not a subscription, because pay once was the strongest line on the page. Then I built it: purchases SDK, entitlements, restore across devices, store products, sandbox testing, legal flows. And the sting in the tail. The moment an app takes money, non-commercial data licences stop applying to it. A €2.99 unlock did not just add a paywall. It changed the legal basis of every feed in the app.

So I took it out. Free, no purchase, no ads.

The relief was immediate. For a project made because the problem was interesting, free was not the fallback. It was the right answer.

07

Shipped

  • 39 swim spots, Ireland and the UK
  • Jellyfish risk, sharpened by live reports
  • Community sightings: two taps, no account, confirm or clear to keep the feed honest
  • Spill prediction across 5 modelled catchments
  • Official notices, always outranking the model
  • Tides, sea temperature, wind, sun and moon
  • Species guide and sting first aid
  • A designed offline screen, because coastal signal is bad and a blank page is worse
The live product

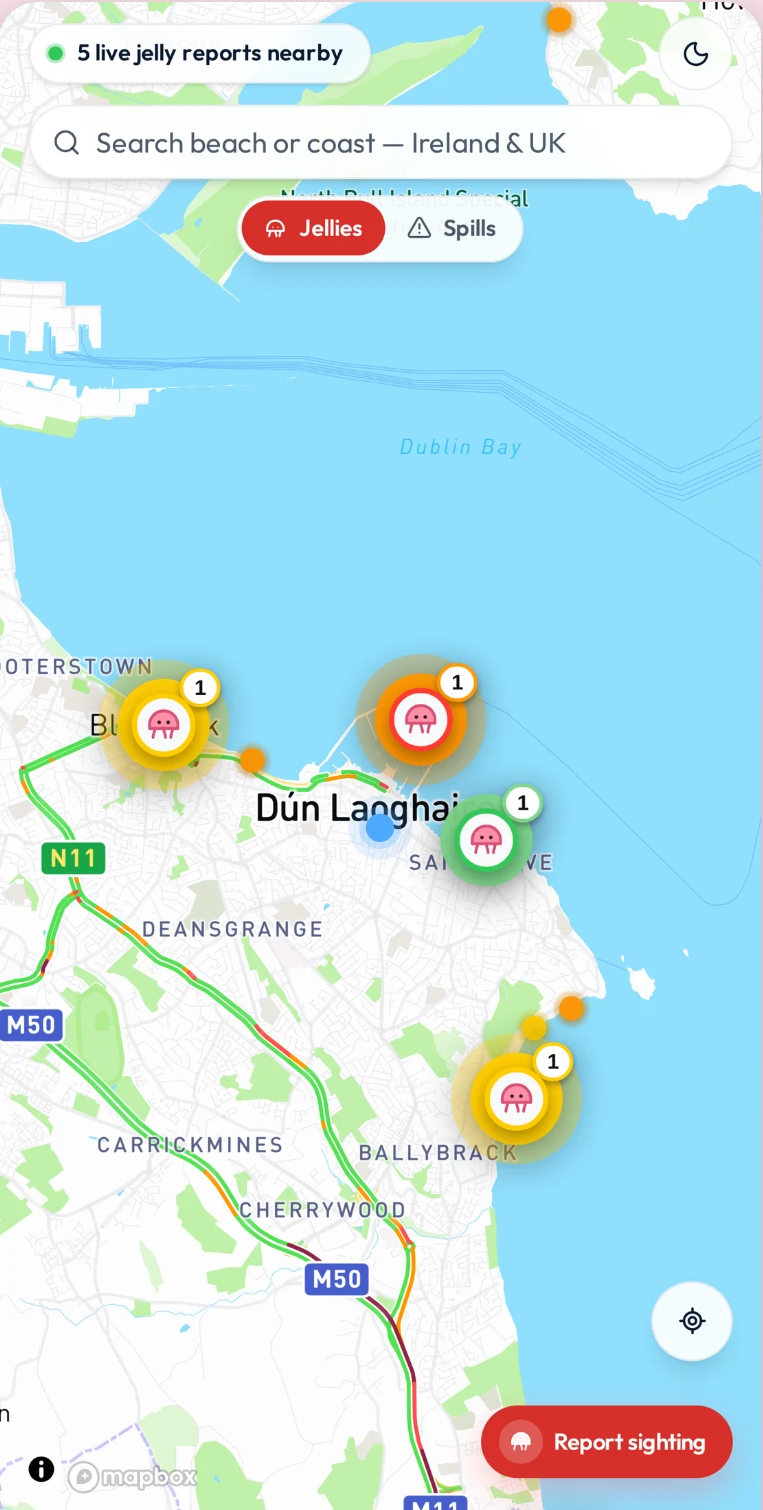
Reports land where the decision is made.

Sightings and official water information share one map, close to the beach and current conditions.

Jelly Map live map of Dublin Bay with colour coded jellyfish sighting pins
Live information before you swim: official water data and live sightings from swimmers.
08

Stack

Design and direction

  • Figma: thinking, flows, visual language

Build

  • Lovable: the app itself. React, server rendered, live editable
  • Claude Code and Cowork: logic, data modelling, API adapters
  • Terminal and Git: version control and the hands-on bits

Data and backend

  • Supabase: Postgres for sightings, votes and cached conditions
  • Environment Agency, Met Éireann, MET Norway: observed rainfall and forecast
  • EPA Ireland: official bathing water notices
  • Open-Meteo: tides, sea temperature, marine
  • Mapbox and OpenStreetMap: maps and coastline

Ship

  • Capacitor: native iOS shell, local notifications, on-device preferences
  • Xcode: archive, signing, upload
  • App Store Connect: submission and review

Removed before launch

  • RevenueCat: in-app purchase. Built, tested, then taken out
09

Next

Make a young feed feel alive

Lead with the forecast, show season totals, never display a zero.

Let sightings fade, not expire

Lose weight gradually, stay visible as history. Confirming restores them.

Build for the person who checks for eight others

Sea swimming runs on group chats. Someone answers “are we on?” every morning. That is the real user.

Let the season reorder the home screen

Jellyfish are summer. Water quality is year round.

10

Reflections

The best finding was a question, not an answer.

“Any jellyfish?” was already being asked constantly. I did not create demand. I noticed a habit.

Users tripled my scope and were right every time.

None of it was in my first draft.

Honesty was the hardest constraint and the best one.

Every choice that made the product feel less confident made it more trustworthy.

Free was easier, more fun and cheaper.

Taking the paywall out removed a whole category of work, and the running costs with it.

The build culture I have enjoyed at work holds up on a hobby project.

Not for everything, and not without a lot of reading. But for something born from a question shouted up a ladder, a designer with a clear vision can now just make the thing, and have a good time doing it.

11

Credits and sources

Built with Lovable, Claude Code, Capacitor and Xcode. Data from the Environment Agency, Met Éireann, MET Norway, EPA Ireland, Open-Meteo, OpenStreetMap and Mapbox.

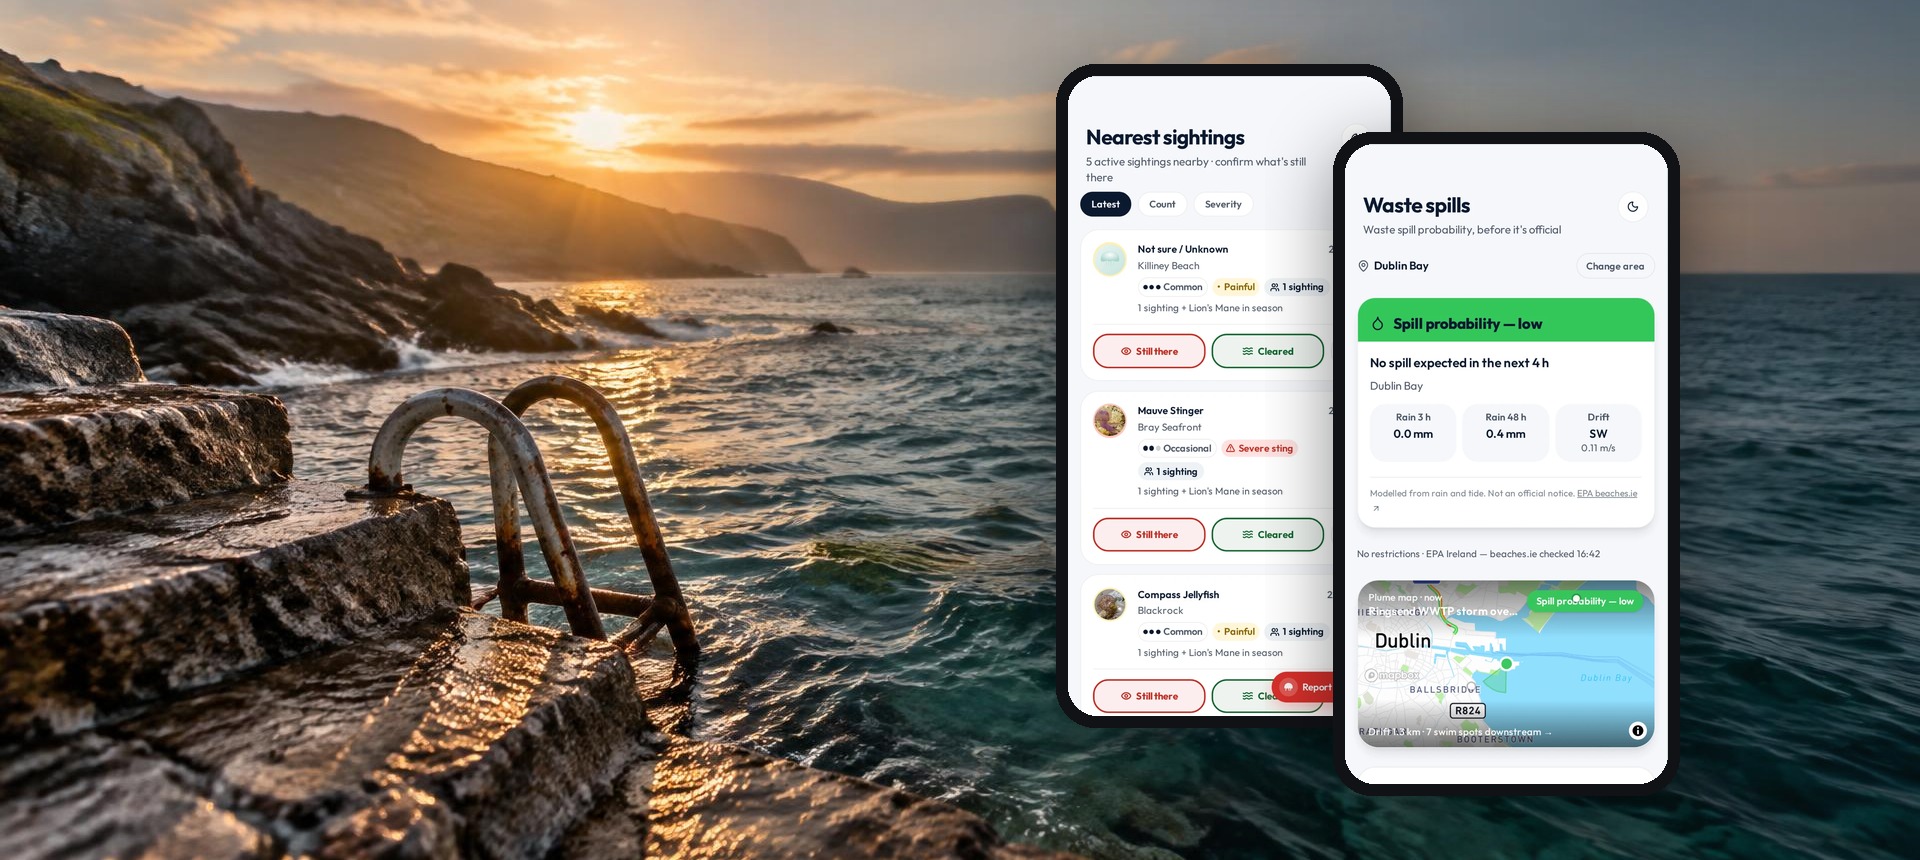
Final Jelly Map app design shown on two phones at a sunlit rocky swimming spot, with nearest sightings and waste spill probability
Final app design